黃金投資版 》
指標MACD和RSI的詮釋

救命!我對各種指標一竅不通。不知哪位好心人可以幫個忙,解釋一下這段話?
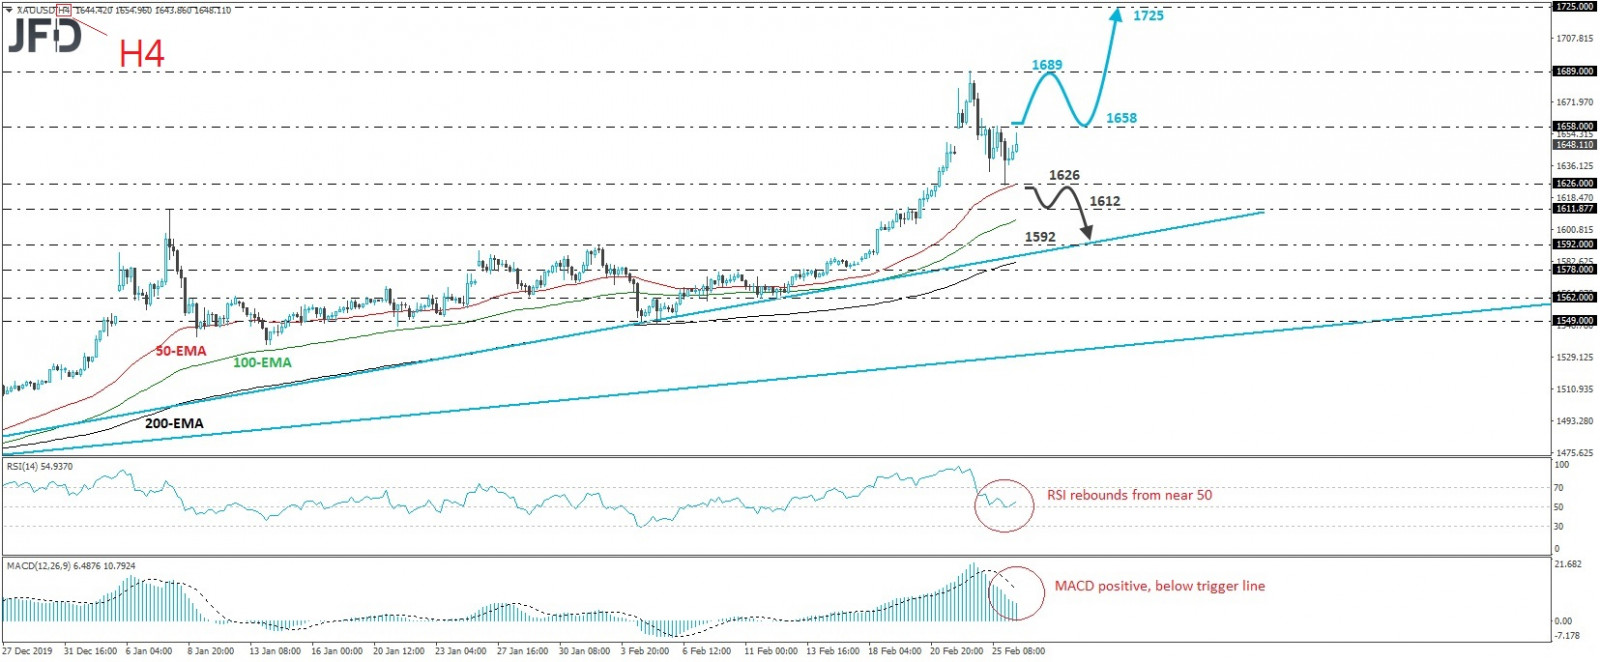
將注意力轉移到我們的短期震盪指標上,我們看到RSI在其50的關口附近兩次觸及支撐位並上漲,而MACD雖然在其觸發線之下,但有跡象表明它可能開始在其積極區域內觸底。兩項指標均表明,金價可能已開始再次開始上漲,並支持下一輪上漲的觀點。
Shifting attention to our short-term oscillators, we see that the RSI hit support twice near its 50 barrier and turned up, while the MACD, although below its trigger line, shows signs it could start bottoming within its positive territory. Both indicators suggest that the yellow metal may have started gathering upside momentum again and support the notion for another round of advances.